Independent Design Sprint · Regulated Utility
A Two-Layer Outage Communication System
FORMAT — 5-day design sprint
FOCUS — Service design, CX strategy
SUBJECT — Consumers Energy
An independent, self-directed sprint conducted using publicly available sources. Not affiliated with, commissioned by, or endorsed by Consumers Energy. No internal data was accessed.

Layer 2 — live outage map

Layer 2 — proactive alerts
Layer 2 — restoration timeline
OVERVIEW
The 30-Second Version
Consumers Energy has built strong outage infrastructure — a 5-stage ETR tracker, two-way SMS, and a live outage map. During an active outage, customers experience none of it personally. This independent 5-day design sprint produced a two-layer solution: immediate content improvements that ship on existing infrastructure, and a proactive Storm Mode tracker that reaches customers before they go looking.
THE BRIEF
What CE Was Missing
Regulated utilities face a trust problem that has nothing to do with their grid. Customers don’t lose faith when the power goes out; they lose faith when no one tells them what’s happening at their address, why the restoration time changed, or how long they’ll actually be in the dark.
Consumers Energy has the infrastructure. The communication layer is missing.
Three failure modes drove the design: the outage map shows regions, not addresses. ETR shifts without explanation. And the app is reactive — customers have to go looking for information that should find them.
The solution couldn’t just address the user need. It had to account for what CE could ship now versus what required engineering investment.
The emotional arc of a CE customer during an outage — the low point isn’t the outage, it’s the ETR shifting with no explanation.
RESEARCH
Working With What’s Public
App Store & Google Play
Reviews, Jan–Feb 2026
Reviews from January and February 2026 describe an app that logs people out, opens to a blank screen, or shows generic status during major storms. The pattern is consistent: it fails at the moment it matters. Reviewers who praise it name the outage tracker specifically — the feature works when the app does.
BBB Complaint Logs
Filed grievances
Filed grievances repeat one word for shifting restoration times: lies. The complaints also show what happens after — transfers between departments, promised callbacks that never come, and cases marked Answered by the business but never Resolved by the customer. The loop closes internally, not with the person waiting.
MPSC Audit Findings
Regulatory record
A 2024 Michigan Public Service Commission audit found Consumers overuses catchall “weather” and “unknown” cause codes. The regulator named it as a transparency gap. A customer reading “unknown cause” has no way to judge whether to wait an hour or leave the house.
CE Outage Center
Public status pages
Consumers publishes a five-stage Road to Restoration and runs two-way SMS — text OUT to report, STAT for status. The infrastructure is real. But the first ETR is auto-generated from historical averages before any crew has seen the damage, and the outage map refreshes roughly every fifteen minutes.
r/Michigan
Utility discussion threads
Everything public pointed the same direction. Over ten percent of customers experienced four or more interruptions in 2023, so this isn’t a storm-season anomaly. One documented case saw the ETR change five times across four days. And the mechanism behind it is published in Consumers’ own material: the first estimate a customer receives is generated from historical averages before a crew has assessed anything, which means the number that sets their expectations is the one least likely to be right.
The complaints are not about the outage. They are about being given a number, watching it move, and never being told why.
Mid-sprint I found that Consumers already had address-level outage data — the granularity I had assumed was the missing piece was already there. That should have been a setback. Instead it clarified the problem: this was never a data problem. The information existed and simply never reached the customer in a form they could act on, at a moment they could use it. The build shrank from new infrastructure to a communication layer on top of infrastructure that already worked, which is also why Layer 1 ships without engineering.
THE FINDING
What the Research Revealed
Calm
Concerned
Frustrated
Escalated
Defeated
The emotional low point is not the outage itself. It’s the ETR shifting to tomorrow morning with no explanation.
That single insight determined everything. The highest-leverage design intervention wasn’t a better map or faster data — it was a “Why the change?” moment. A plain-language explanation of why the restoration time moved, surfaced exactly when a customer needs it most.
THE SOLUTION
Two-Layer Solution
Designing for a regulated utility means designing for two timelines simultaneously. Layer 1 exploits what CE already has. Layer 2 earns its place on the roadmap.
Layer 1 — Updated Outage Content
Low Effort
Ships On Existing Infrastructure
No New Backend
Improving what CE already has: address-level personalization, honest ETR language, plain-language cause explanations, source transparency, and a post-restoration survey with bill credit follow-up.

Plain-language outage entry point

Honest ‘no ETR yet’ language

Live homes-affected count

First ETR with crew status

Crew-on-scene update with cause

Honest ETR change — ‘why the change?’

Post-restoration recap
Layer 2 — Storm Mode Tracker
Medium Effort
Roadmap
Pending Engineering Validation
A proactive experience that activates before the customer goes looking. CE reaches them first via Live Activity lock screen notification, deep linking into a full-screen Storm Mode tracker with crew progression states and real-time ETR updates.
Reaching out first
CE communicates before the customer goes looking.
01
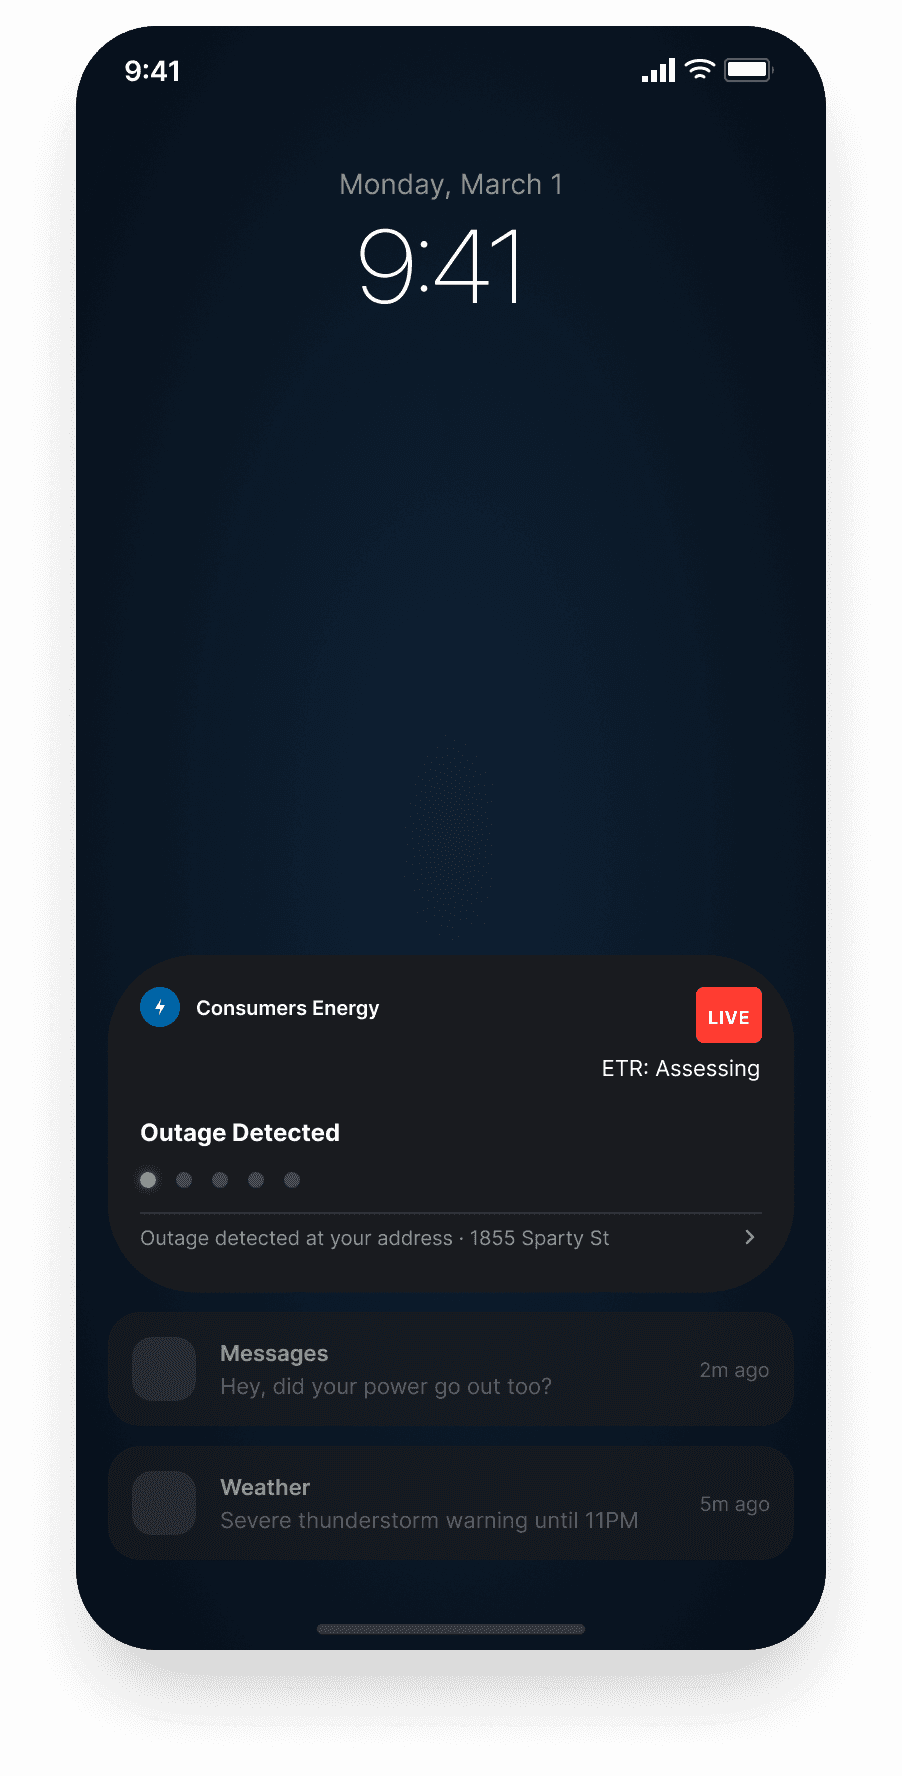
The lock-screen Live Activity reaches the customer first — ETR shown as Assessing, not a false estimate.
›
02
The deep-link entry choice — check your own home or scan the wider neighborhood before deciding what to do next.
Honest while uncertain
N/A instead of a number CE can’t yet stand behind.
03

Outage Reported — ETR reads N/A for ~22 homes. CE won’t invent a number it can’t yet stand behind.
›
04

Location Assessed — homes affected keep rising, yet the ETR still holds at N/A rather than guessing.
›
05
Crew En Route — only now, with a crew committed, does the first real ETR replace N/A.
Explaining and closing
The ETR moves — and CE says why.
06

THE KEY MOMENT — the ETR shifts and a “Why the change?” explanation appears inline — the intervention this whole study builds toward.
›
07

Cause identified — pole damage from the weather — and the ETR is updated again, always paired with the reason.
›
08
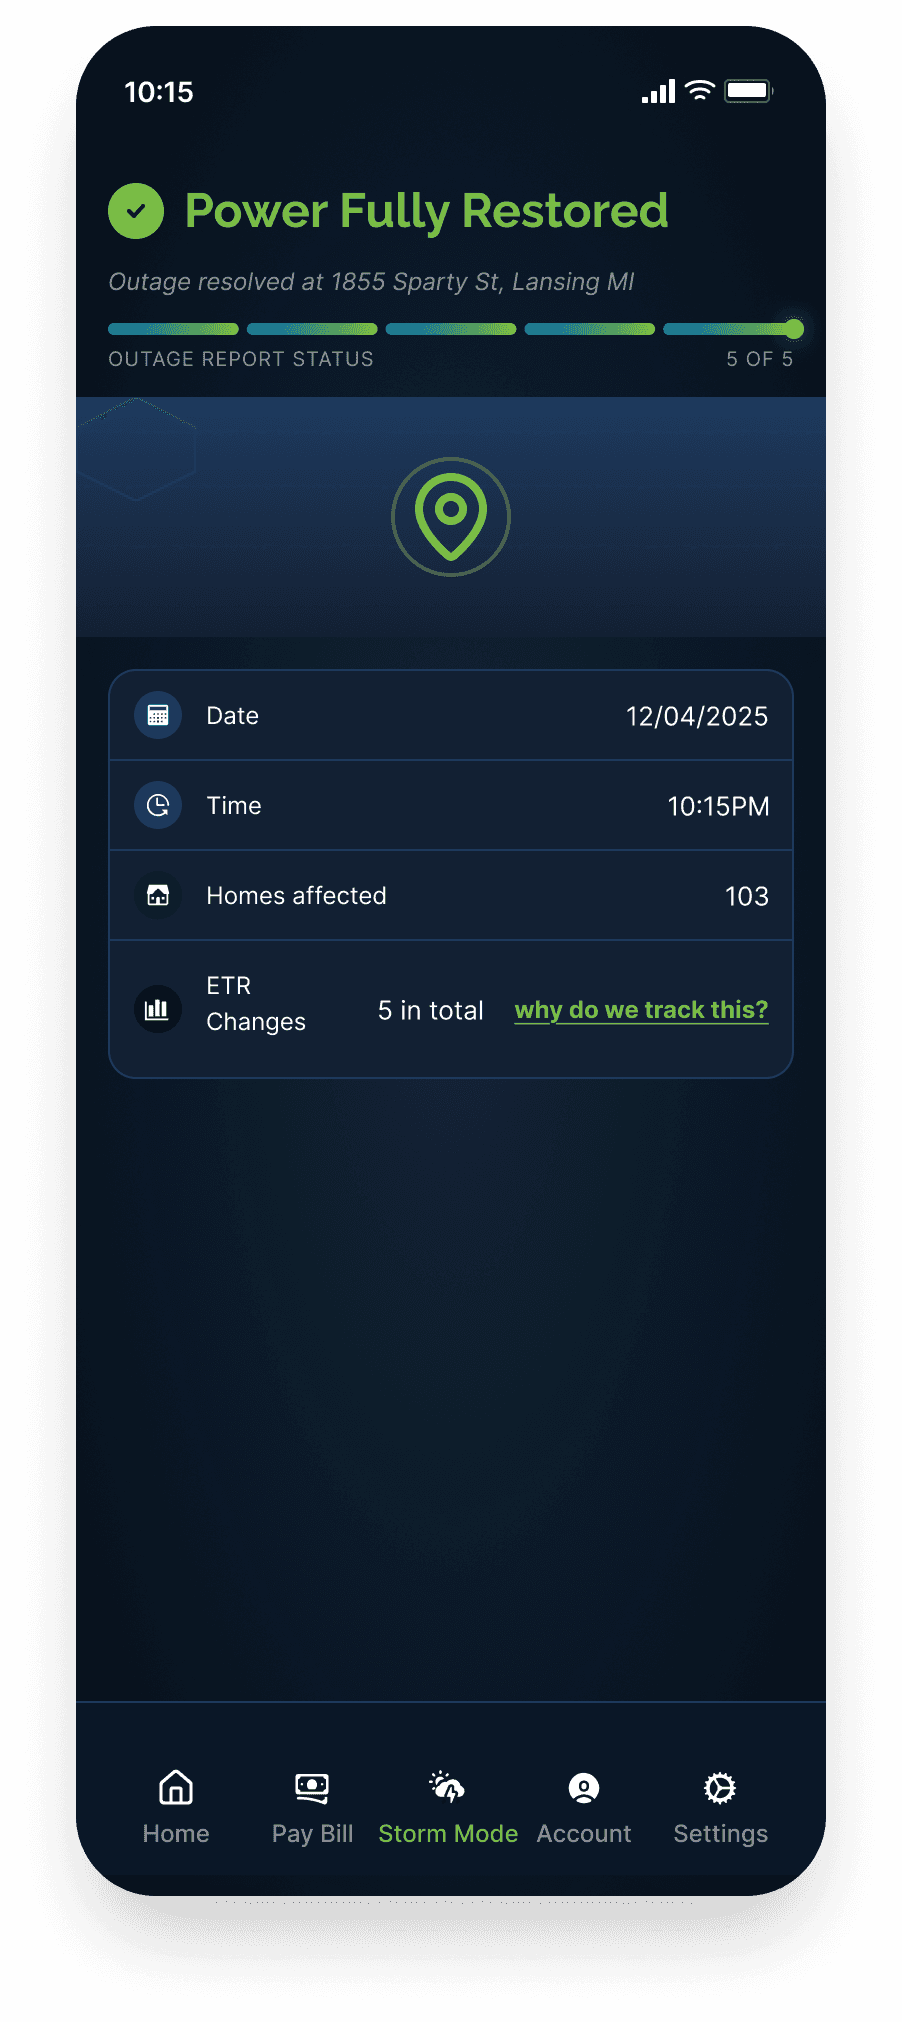
Power Fully Restored — the closing summary, transparent about how many times the ETR changed along the way.
BUSINESS CASE
What’s at Stake
Layer 1 has an immediate ROI. Layer 2 is strategic investment.
15–20%
Inbound call deflection
Projected reduction in outage-related calls during storm events, driven by proactive notification reaching customers before they dial.
8–12 pts
CSAT lift, outage experience
Projected gain from resolving the two highest-complaint categories: ETR accuracy and cause transparency.
$15–20K
Cost avoided per storm event
At 10,000 storm-event calls and $10 per contact, total contact cost is roughly $100K. A 15–20% deflection avoids $15–20K of it.
#1
Driver of CE detractors
Outage experience is the leading source of detractor sentiment in the public record. Communication is the lever available without touching the grid.
Layer 1 ships immediately with no new backend. Layer 2 earns its roadmap position through engineering validation.
Directional projections modeled from public complaint data and industry contact-cost benchmarks. Contact cost assumes $10 per call, an industry benchmark, not a Consumers Energy figure. No internal data was used.
PRINCIPLES
The Principles Behind Every Decision
01
Proactive over reactive
Live Activity reaches the customer before she opens the app. CE communicates first.
02
Honest over optimistic
ETR shows N/A with plain language rather than a false estimate.
03
Personal over aggregate
Address-level status replaces neighborhood-level map data.
04
Transparent over polished
“Why the change?” surfaces CE’s imperfection rather than hiding it.
05
Closure over silence
Post-restoration survey and credit closes the emotional arc.
NEXT
If I Had More Time
01
Ship Layer 1 immediately
No engineering dependency. Measurable CSAT impact within one storm cycle. This is the fastest proof point for Layer 2 investment.
02
Pilot Layer 2 in a single Michigan market
Controlled rollout allows CE to validate Live Activity performance under real storm load before committing to full engineering build.
03
Validate Layer 2 feasibility with app engineering
Real-time address-level push at scale during peak storm load is the critical gate before roadmap commitment.
04
Run unmoderated prototype test
20 participants via Maze or UserTesting. Measure completion rate, drop-off points, and taxonomy comprehension across the full flow.